7 Ways to ensure your infographic is indexed by Google
Do you know how much information is generated on a daily basis? The answer lies in this real-time counter.
In an age where information overload is at an all-time high and attention spans are at their lowest, a visual break goes a long way in holding the reader’s interest. If your digital content involves intensive number-crunching – statistics, data, and facts – condensing this into a well-designed infographic is a good idea.
Consider these statistics:
- The human brain is better equipped to store visual information; 65% of information seen via images can be retained for up to three days.
- 40% of people process information faster if it is in the form of visuals.
- A study by 3M finds that we can process visuals 60,000 times faster than text.
- For publishers, incorporating infographics in their content can lead to a 12% jump in traffic.
However, simply creating an infographic-led post does not amount to a rise in traffic. An infographic that has not been optimised for search engines will simply remain a plain JPG, PNG, or GIF file, untapped by Google.
Here are seven ways to ensure infographic optimisation:
1) Get the appropriate keywords
Infographic optimisation through apt short-tail and long-tail keywords is a great way to begin. A short-tail keyword contains only one or two words and is less specific, such as ‘infographics’. Long-tail keywords, on the other hand, are longer and more specific, e.g. ‘effectiveness of infographics’. Short-tail keywords are searched for more often, but long-tail keywords make up a majority of Google searches.
Tools like Google Keyword Planner will help you understand the best keywords to target for your infographic. While the keywords used in your infographic aren’t detectable, unlike keywords in a text file, there are several ways to ensure Google sees your infographic for what it is, and not just as another JPG file.
2) Name your infographic
Google relies on an infographic’s filename to understand what it contains. Hence, instead of a generic ‘infographic1.jpg’, try something along the lines of ‘visual-content-effectiveness-infographic.jpg’. This will help Google’s algorithms read your file better, ranking it higher in searches for similar infographics.
3) Pay attention to URLs
URLs tend to be automated and contain words from the page’s headline, separated by several hyphens. But did you know a URL works best if it is short, crisp, and includes the infographic’s primary keywords? Here are a few things to keep in mind for search engine optimisation (SEO) of a URL, as outlined in detail by Neil Patel:
- Choose a short URL; in fact, the shorter the better. Try not to put more than 3-5 relevant words in your URL.
- Ensure your URLs are readable – give users an idea of what to expect from your link through the URL itself. Avoid using symbols as much as possible (although hyphens are welcome)!
- Use lowercase letters only. Uppercase can lead to 404 errors or page redirects.
4) Get the meta description right
An HTML meta description is a snippet of 155-160 words used for SEO. It is the description that pops up to describe a link whenever you put in a search term. When written well, it accurately and crisply tells Google everything it needs to know about the contents of your page. This is especially important for infographics, since the text they contain is part of an image, and hence inaccessible to Google.
5) Don’t ignore H1 tags
An H1 tag is the title of your post. Ensure that the heading of your post contains the keyword of your infographic. For instance, your page with the keyword ‘effectiveness of infographics’ can have a header such as ‘Effectiveness of infographics: does visual content score over text?’
6) Include supporting text
Try not to post the infographic with minimal text in the body of the piece. Break down the supporting text in the form of a story and explain what the infographic is trying to convey. You need to have at least 300 words as supporting text along with the infographic for an optimal SEO score.
7) Lastly, don’t forget the Alt text
Alt text is a description of your image and is useful in instances where your infographic won’t load. Also, think of it as an additional way to ensure Google knows what your infographic contains. For instance, our example infographic can have a simple, crisp descriptor such as ‘Why visual content works better than text’.
There are several more ways to ensure infographic optimisation, but these are the seven ideal ones that should definitely help boost traffic on your website.
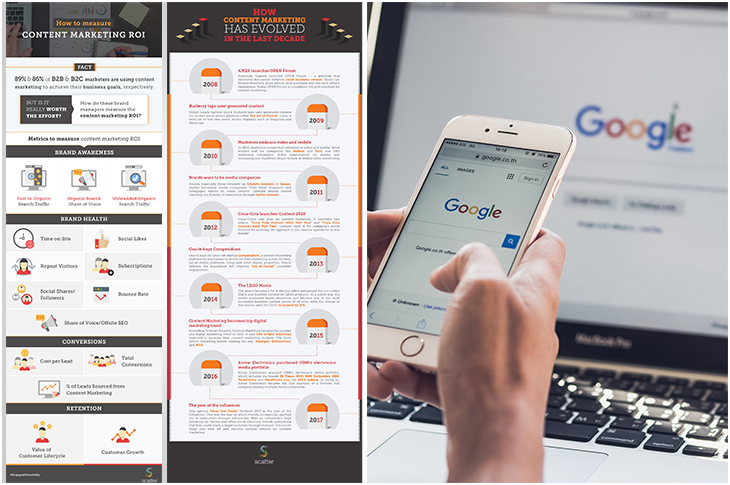
For a better understanding, here’s an example of an infographic we published on the Scatter blog.